Reports in minutes, not hours.
Pipeline analytics and reporting, built for real estate investment teams.
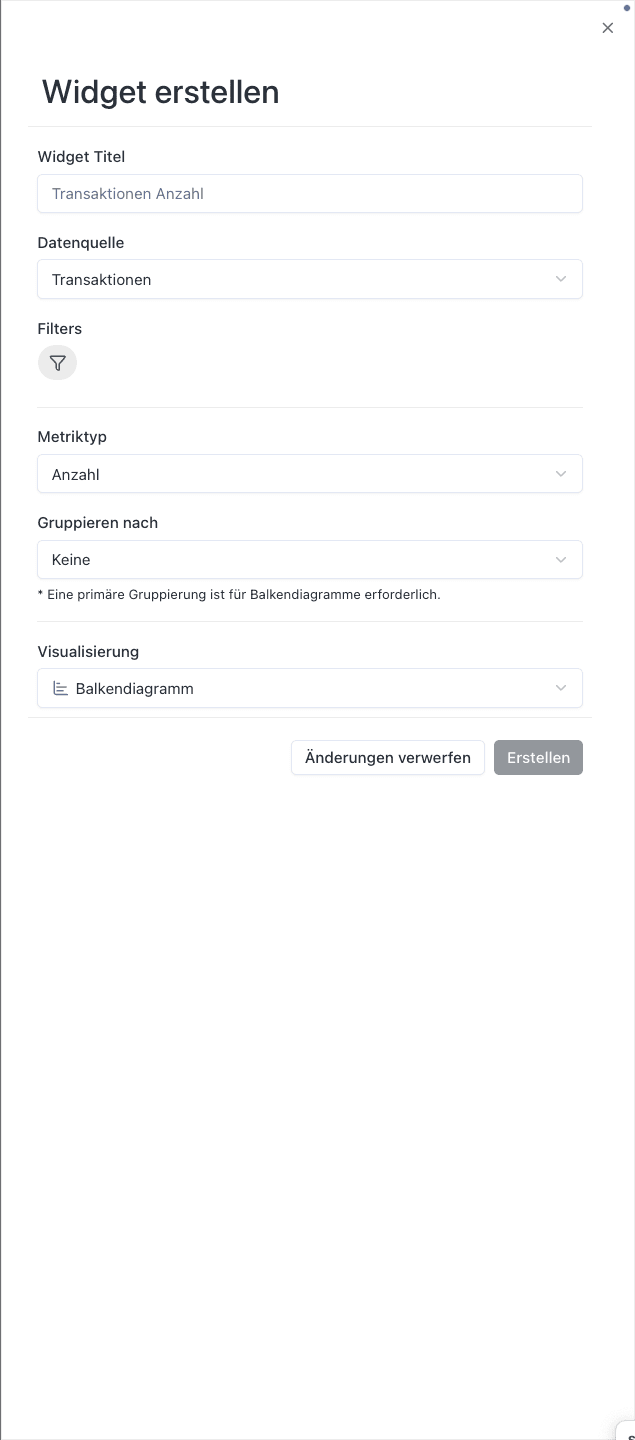
Your full pipeline, in one view.
Dashboards that track deal flow by stage, provider, captain, geography, and label - live, filtered, and always current.
Drill into what's behind the numbers.
Click any metric to see the contributing deals. Slice by time period, status, or team member - and understand what's actually driving your pipeline.
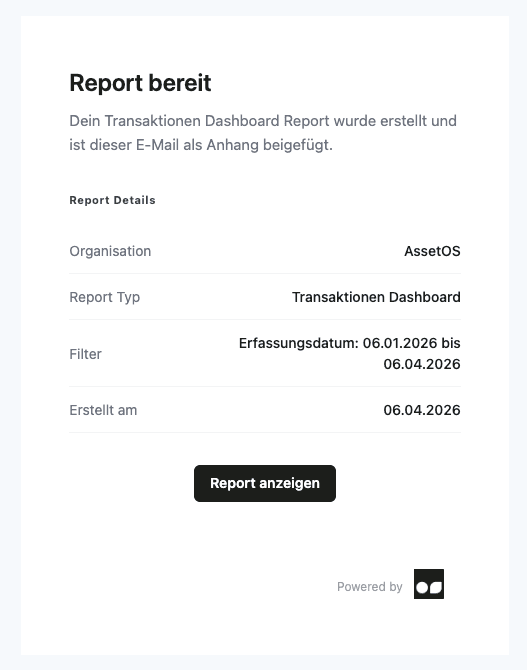
Send the report - not a spreadsheet.
Turn any filtered dashboard view into a branded PDF or PowerPoint. Apply your filters, add recipients, and the right stakeholders get exactly what they need.

Each team sees what they need.
Build custom dashboard views for deal captains, provider reviews, or executive and board committees. Save default filters so every team starts from the right context.
Explore the platform
01Deal Intake
Every deal, structured from the first email.
02Pipeline
Run your pipeline meeting from one live view.
03Analysis
One deal, one workspace. Everything in context.
04AI Due Diligence
Upload the documents. Get the findings.
05Collaboration
One place for your team and your counterparties.
06Reporting
Reports for management and board committees.
07CRM
Every email, in the context of your deal.
08Document Generation
IC Memos, NBOs/BOs, rejections. Generated, not drafted.
FAQ
See AssetOS in action
A short demo to show how AssetOS fits into your workflow.